Lab K205 - Monitoring setup with HELM
In this lab, you are going to install and configure helm, and in turns, use it to configure a monitoring system for kubernetes using prometheus and grafana stack.
Installing Helm (version 3)
To install helm version 3 on Linux or MacOS, you can follow following instructions.
curl https://raw.githubusercontent.com/helm/helm/master/scripts/get-helm-3 | bash
You could further refer to Official HELM Install Instructions for alternative options.
Verify the installtion is successful,
helm --help
helm version
Deploy Prometheus Stack with HELM
Read about kube-prometheus-stack 33.1.0 · prometheus/prometheus-community chart at artifacthub.io
Add helm repository using ,
helm repo add prometheus-community https://prometheus-community.github.io/helm-charts
helm repo update
Download the chart as,
cd ~
helm fetch --untar prometheus-community/kube-prometheus-stack
Change into the charts directory
cd kube-prometheus-stack/
ls
Deploy prometheus stack as,
kubectl create ns monitoring
helm install prom -n monitoring prometheus-community/kube-prometheus-stack
Validate
helm list -A

kubectl get all -n monitoring
kubectl get pods,svc -n monitoring
Customising Prometheus Configurations
To update the Grafana service to use NodePort configurations, upgrade the helm release by setting up customized properties as,
helm upgrade prom -n monitoring prometheus-community/kube-prometheus-stack \
  --set grafana.service.type=NodePort \
  --set grafana.service.nodePort=30200
Validate
helm list -A

kubectl get svc -n monitoring
You should see new revision of monitoring stack deployed, and Grafana service changed to NodePort.
Note down the node port and access Grafana with
http://IPADDRESS:30200
remember to replace node name/ip address and node port as actual.
Login using
User : admin
Pass: prom-operator
Once logged in, you should be able to browse and view Grafana dashboards from Dashboards menu.
An example dashboard is as follows,

You could further explore various Grafana dashboards and configurations.
Import EKS Dashboard
You could import EKS Specific Dashboard onto grafana using the following instructions.
- From Dashboards -> New -> Import
- Provide Dashboard ID as
17119, select Load - Select Prometheus Data Source instance
- Import
Once imported,
- go to Dashboard Settings -> Variables
- select
node - on configuration page,Query options -> Query select Metric as
kube_pod_info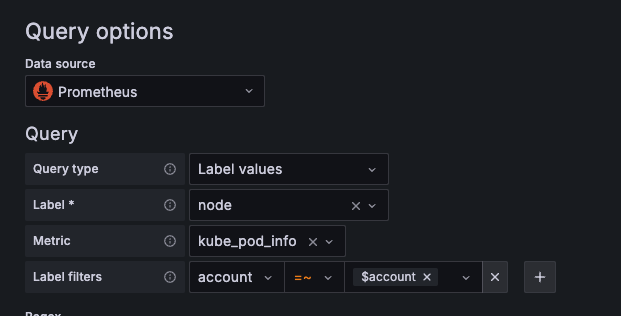
- Ensure Label is set to
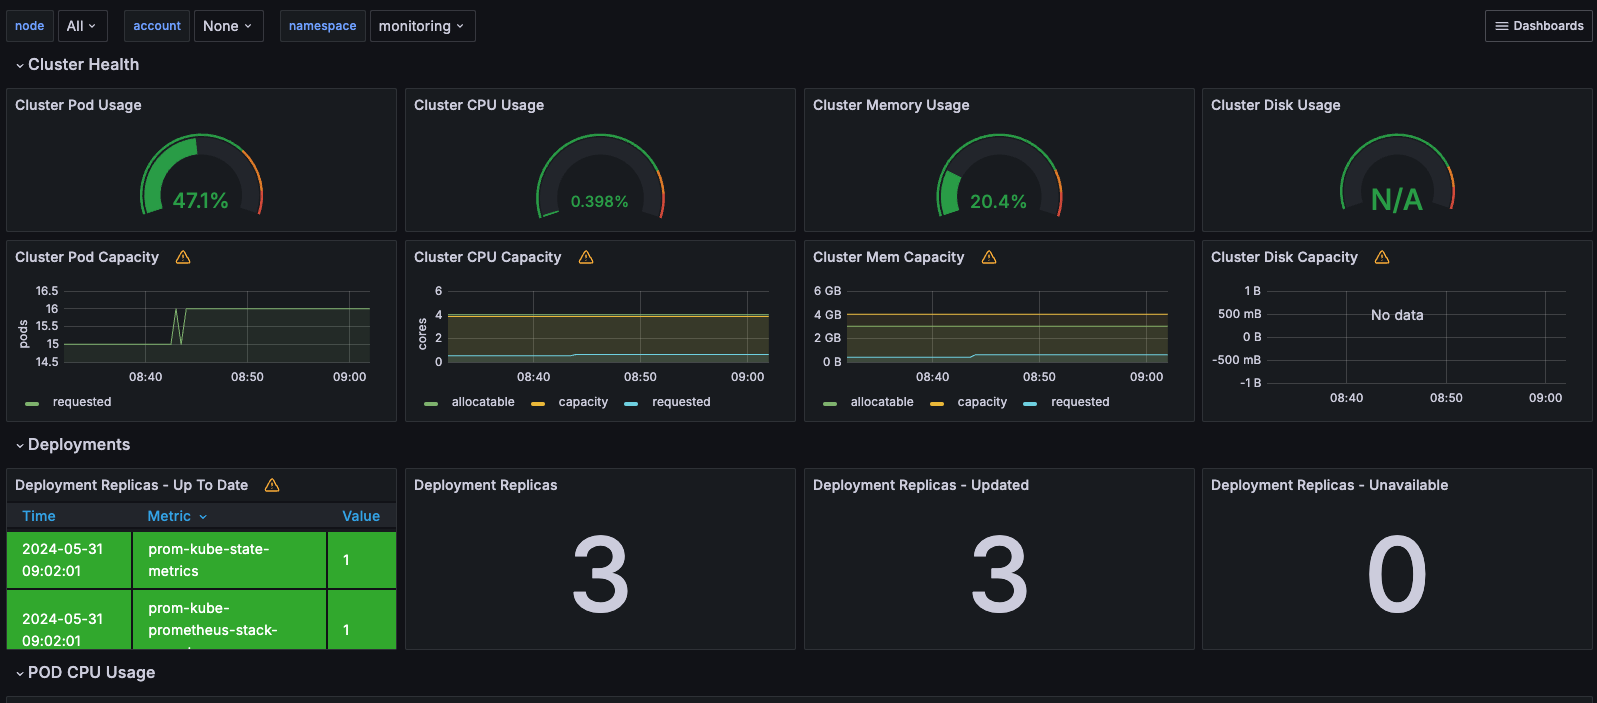
node - Save Dashboard
When you switch back to the dashboard you should see cluster health
You could try installing additional dashboards e.g.
Uninstalling the App with HELM
Once you are done experiementing and learning, you could uninstall the application stack that you earlier installed with helm easily.
To uninstall prometheus and grafana stack, begin by listing it
helm list -A
helm uninstall -n monitoring prom
This should clean up everything that was deployed with helm earlier.
Summary
In this lab, we not only learnt about HELM, a kubernetes package manager, but also have setup a sophisticated health monitoring system with prometheus and grafana.