Autoscaling Pods with HPA
With Horizontal Pod Autoscaling, Kubernetes automatically scales the number of pods in a replication controller, deployment or replica set based on observed CPU utilization (or, with alpha support, on some other, application-provided metrics).
The Horizontal Pod Autoscaler is implemented as a Kubernetes API resource and a controller. The resource determines the behavior of the controller. The controller periodically adjusts the number of replicas in a replication controller or deployment to match the observed average CPU utilization to the target specified by user
Prerequisites
- Metrics Server. This needs to be setup if you are using kubeadm etc. and replaces heapster starting with kubernetes version 1.8.
- Resource Requests and Limits. Defining CPUas well as Memory requirements for containers in Pod Spec is a must
Deploying Metrics Server
Kubernetes Horizontal Pod Autoscaler along with kubectl top command depends on the core monitoring data such as cpu and memory utilization which is scraped and provided by kubelet, which comes with in built cadvisor component. Earlier, you would have to install a additional component called heapster in order to collect this data and feed it to the hpa controller. Starting with 1.8 version of Kubernetes, this behavior is changed, and now metrics-server would provide this data. Metric server is being included as a essential component for kubernetes cluster, and being incroporated into kubernetes to be included out of box. It stores the core monitoring information using in-memory data store.
If you try to pull monitoring information using the following commands
kubectl top pod

kubectl top node
it does not show it, rather gives you a error message similar to
[output]
Error from server (NotFound): the server could not find the requested resource (get services http:heapster:)
Even though the error mentions heapster, its replaced with metrics server by default now.
Deploy metric server with the following commands,
cd ~
git clone https://github.com/schoolofdevops/metrics-server.git
kubectl apply -k metrics-server/manifests/overlays/release
Validate
kubectl get deploy,pods -n kube-system --selector='k8s-app=metrics-server'
You could validate again with
kubectl top pod

kubectl top node
where expected output should be similar to,
kubectl top node

NAME                 CPU(cores)   CPU%   MEMORY(bytes)   MEMORY%
kind-control-plane   123m         6%     688Mi           17%
kind-worker          39m          1%     498Mi           12%
kind-worker2         31m          1%     422Mi           10%
If you see a similar output, monitoring is now been setup.
Create a HPA
To demonstrate Horizontal Pod Autoscaler we will use a custom docker image based on the php-apache image
file: vote-hpa.yaml
apiVersion: autoscaling/v2
kind: HorizontalPodAutoscaler
metadata:
  name: vote
spec:
  minReplicas: 2
  maxReplicas: 10
  metrics:
    - type: ContainerResource
      containerResource:
        name: cpu
        container: vote  # change this as per actual container name
        target:
          type: Utilization
          averageUtilization: 50
  scaleTargetRef:
    apiVersion: apps/v1
    kind: Deployment # change it to Deployment if have created a deployment already
    name: vote
  behavior:
    scaleDown:
      policies:
      - type: Pods
        value: 2
        periodSeconds: 120
      - type: Percent
        value: 25
        periodSeconds: 120
      stabilizationWindowSeconds: 60
    scaleUp:
      stabilizationWindowSeconds: 45
      policies:
      - type: Percent
        value: 100
        periodSeconds: 15
      - type: Pods
        value: 2
        periodSeconds: 15
      selectPolicy: Max
apply
kubectl apply -f vote-hpa.yaml
Validate
kubectl get hpa
you should see
[sample output]
NAME   REFERENCE         TARGETS   MINPODS   MAXPODS   REPLICAS   AGE
vote   Deployment/vote   2%/50%    2         10        2          12m
If you see unknown/50% under TARGETS, there is a underlying issue that you may need to resolve. Check if you have defined the resources (rquests, limits) for the containers in the pod.
kubectl describe hpa vote

kubectl get pod,deploy
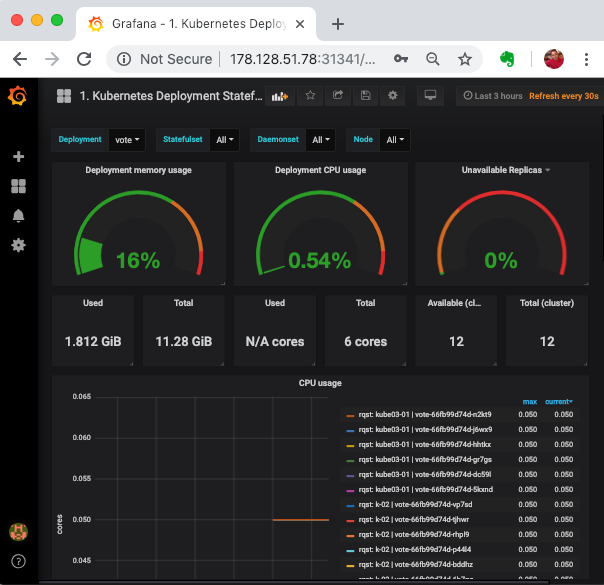
If you have a monitoring system such as grafana, you could also view the graphs for vote deployment.
Launch a Load Test
If you do not have the service for vote app to receive the traffic, create one as
cd k8s-code/projects/instavote/dev
kubectl apply -f vote-svc.yaml
Prepare to monitor the autoscaling by opening a new window connected to your cluster and by launching,
watch 'kubectl top pods;kubectl get pods; kubectl get hpa ; kubectl get deploy'
Create a Load Test Job as,
file: loadtest-job.yaml
apiVersion: batch/v1
kind: Job
metadata:
  generateName: loadtest
spec:
  template:
    spec:
      containers:
      - name: siege
        image: schoolofdevops/loadtest:v1
        command: ["siege",  "--concurrent=1", "--benchmark", "--time=4m", "http://vote"]
      restartPolicy: Never
  backoffLimit: 4
and launch it as
kubectl create -f loadtest-job.yaml
This will launch a one off Job which would run for 4 minutes.
To get information about the job
kubectl get jobs
kubectl describe  job loadtest-xxx
replace loadtest-xxx with actual job name.
To check the load test output
kubectl logs -f loadtest-xxxx
[replace loadtest-xxxx with the actual pod id.]
[Sample Output]
** SIEGE 3.0.8
** Preparing 15 concurrent users for battle.
root@kube-01:~# kubectl logs vote-loadtest-tv6r2 -f
** SIEGE 3.0.8
** Preparing 15 concurrent users for battle.

.....


Lifting the server siege...      done.

Transactions:              41618 hits
Availability:              99.98 %
Elapsed time:             299.13 secs
Data transferred:         127.05 MB
Response time:              0.11 secs
Transaction rate:         139.13 trans/sec
Throughput:             0.42 MB/sec
Concurrency:               14.98
Successful transactions:       41618
Failed transactions:               8
Longest transaction:            3.70
Shortest transaction:           0.00

FILE: /var/log/siege.log
You can disable this annoying message by editing
the .siegerc file in your home directory; change
the directive 'show-logfile' to false.
Now check the job status again,
kubectl get jobs
NAME            DESIRED   SUCCESSFUL   AGE
vote-loadtest   1         1            10m
While it is running,
- Keep monitoring for the load on the pod as the job progresses.
- You should see hpa in action as it scales out/in the vote deployment with the increasing/decreasing load.
Summary
In this lab, you have successful configured and demonstrated dynamic scaling ability of kubernetes using HorizontalPodAutoscaler. You have also learnt about a new jobs controller type for running one off or batch jobs.