Analysis and Experiments
Setup Metrics Server
If you try to pull monitoring information using the following commands
kubectl top pod

kubectl top node
it does not show it, rather gives you a error message similar to
[output]
Error from server (NotFound): the server could not find the requested resource (get services http:heapster:)
Even though the error mentions heapster, its replaced with metrics server by default now.
Deploy metric server with the following commands,
cd ~
git clone https://github.com/schoolofdevops/metrics-server.git
kubectl apply -k metrics-server/manifests/overlays/release
Validate
kubectl get deploy,pods -n kube-system --selector='k8s-app=metrics-server'
You could validate again with
kubectl top pod

kubectl top node
where expected output should be similar to,
kubectl top node

NAME                 CPU(cores)   CPU%   MEMORY(bytes)   MEMORY%
kind-control-plane   123m         6%     688Mi           17%
kind-worker          39m          1%     498Mi           12%
kind-worker2         31m          1%     422Mi           10%
If you see a similar output, monitoring is now been setup.
Deploy Prometheus and Grafana
Set up repository
helm repo add prometheus-community https://prometheus-community.github.io/helm-charts
helm repo update
Install Prometheus and Grafana as
helm upgrade --install prom -n monitoring \
  prometheus-community/kube-prometheus-stack \
  --create-namespace \
  --set grafana.service.type=NodePort \
  --set grafana.service.nodePort=30400 \
  --set prometheus.prometheusSpec.podMonitorSelectorNilUsesHelmValues=false \
  --set prometheus.prometheusSpec.serviceMonitorSelectorNilUsesHelmValues=false
Redeploy Nginx Ingress Controller
Re deploy nginx ingress controller with helm, this time enabling the exposing the metrics which can then be scraped/collected by prometheus.
helm upgrade --install ingress-nginx ingress-nginx \
  --repo https://kubernetes.github.io/ingress-nginx \
  --namespace ingress-nginx --create-namespace \
  --set controller.metrics.enabled=true \
  --set controller.metrics.serviceMonitor.enabled=true --set \ controller.metrics.serviceMonitor.additionalLabels.release="prometheus" \
  --set controller.hostPort.enabled=true \
  --set controller.hostPort.ports.http=80 \
  --set controller.hostPort.ports.https=443 \
  --set controller.service.type=NodePort \
  --set-string controller.nodeSelector."kubernetes\.io/os"=linux \
  --set-string controller.nodeSelector.ingress-ready="true"
Setup Grafana Dashboard for Nginx Ingress Controller
Now, login to grafana and import custom dashboard for Nginx Ingress as
- Left menu (hover over +) -> Dashboard
- Click "Import"
- Enter the copy pasted json from https://raw.githubusercontent.com/kubernetes/ingress-nginx/main/deploy/grafana/dashboards/nginx.json
- Click Import JSON
- Select the Prometheus data source
- Click "Import"
⠀
It may look similar to this, with possibly less data initially
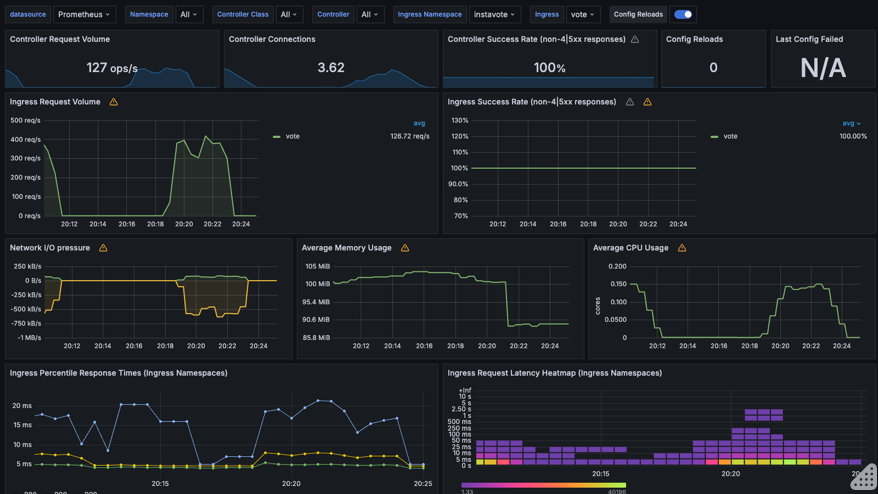
However, if you see some metric coming in, your setup with Nginx Ingress and Promethus Integration is working ! You may pat your back at this time :)
Updated Rollout Configuration with Experiment and Analysis
File: /prod/rollout.yaml
apiVersion: argoproj.io/v1alpha1
kind: Rollout
metadata:
  name: vote
spec:
  replicas: 5
  strategy:
    blueGreen: null
    canary:
      canaryService: vote-preview
      stableService: vote
      steps:
      - setCanaryScale:
          replicas: 2
      - experiment:
          duration: 3m
          templates:
          - name: canary
            specRef: canary
            service:
              name: experiment
          analyses:
            - name: fitness-test
              templateName: canary-fitness-test
      - setWeight: 20
      - pause:
          duration: 10s
      - setWeight: 40
      - pause:
          duration: 10s
      - setWeight: 60
      - analysis:
          templates:
          - templateName: loadtest
          - templateName: latency
      - setWeight: 80
      - pause:
          duration: 10s
      - setWeight: 100
      trafficRouting:
        nginx:
          stableIngress: vote
          additionalIngressAnnotations:
            canary-by-header: X-Canary
            canary-by-header-value: siege
Explanation
-
Rollout Configuration:
-
The rollout strategy includes canary steps with set weights and pauses.
- Each canary step includes an experiment with a specified duration (e.g., 3 minutes).
- The experiment step runs a experimental replicaset and launches a fitness test to validate if the new version looks okay.
-
After 60% traffic is shifted to canary, a load test is lauched along with analysis from prometheus to check if the new version will perform okay with the load.
-
Analysis Templates:
-
Defines a templates for running various tests and analyses.
- The
loadtestcontainer runs the load testing script against the canary service (vote-preview). - The
fitness-testjob runs a test to validate if the new version is fit for deployment. - the
latencyanalysis fetches latency metrics from Prometheus and checks if the application is responding in acceptable time frame even with load conditions.
⠀
How it Works
- At each setWeight step, traffic is gradually shifted to the canary version.
- The analysis step includes both the load test and the metric analysis.
- The experiment runs for 3 minutes, during which the fitness test is conducted.
- Simultaneously with load test , the analysis template checks Prometheus metrics to ensure the canary is performing correctly.
- If the analysis detects errors beyond the acceptable threshold, the rollout will trigger a rollback.
- If the canary passes the load test and analysis, the rollout proceeds to the next step.
⠀ By configuring the experiment and analysis to run in parallel, you can ensure comprehensive testing and validation of the canary version, enabling automatic rollback if any issues are detected.
Template for Load Testing
File prod/loadtest-analysistemplate.yaml
apiVersion: argoproj.io/v1alpha1
kind: AnalysisTemplate
metadata:
  name: loadtest
spec:
  metrics:
  - name: loadtest-vote
    provider:
      job:
        spec:
          template:
            spec:
              containers:
              - name: siege
                image: schoolofdevops/loadtest:v1
                command:
                  - siege
                  - "--concurrent=2"
                  - "--benchmark"
                  - "--time=5m"
                  - "--header='X-Canary: siege'"
                  - "http://vote.example.com"
              restartPolicy: Never
              hostAliases:
              - ip: "xx.xx.xx.xx"
                hostnames:
                - "vote.example.com"
          backoffLimit: 4
where,
* replace xx.xx.xx.xx with internal IP Address of worker node. Find out by using
kubectl get nodes -o wide
[sample output]
NAME                 STATUS   ROLES           AGE     VERSION   INTERNAL-IP   EXTERNAL-IP   OS-IMAGE                         KERNEL-VERSION     CONTAINER-RUNTIME
kind-control-plane   Ready    control-plane   2d23h   v1.30.0   172.18.0.2    <none>        Debian GNU/Linux 12 (bookworm)   6.8.0-31-generic   containerd://1.7.15
kind-worker          Ready    <none>          2d23h   v1.30.0   172.18.0.4    <none>        Debian GNU/Linux 12 (bookworm)   6.8.0-31-generic   containerd://1.7.15
kind-worker2         Ready    <none>          2d23h   v1.30.0   172.18.0.3    <none>        Debian GNU/Linux 12 (bookworm)   6.8.0-31-generic   containerd://1.7.15
From this output, you are going to use 172.18.0.4 in the configuration above.
AnalysisTemplate for Prometheus Metrics
File : prod/latency-analysistemplate.yaml
apiVersion: argoproj.io/v1alpha1
kind: AnalysisTemplate
metadata:
  name: latency
spec:
  metrics:
  - name: nginx-latency-ms
    initialDelay: 1m
    interval: 1m
    failureLimit: 2
    count: 4
    successCondition: result < 50.0
    failureCondition: result >= 50.0
    provider:
      prometheus:
        address: http://prom-kube-prometheus-stack-prometheus.monitoring.svc.cluster.local:9090
        query: |
          scalar(
            1000 * histogram_quantile(0.99,
              sum(
                rate(
                  nginx_ingress_controller_request_duration_seconds_bucket{ingress="vote", exported_namespace="prod"}[1m]
                )
              ) by (le)
            )
          )
Fitness Test for Canary
File: prod/fitness-analysistemplate.yaml
apiVersion: argoproj.io/v1alpha1
kind: AnalysisTemplate
metadata:
  name: canary-fitness-test
spec:
  metrics:
  - name: canary-fitness
    interval: 30s
    count: 3
    successCondition: result == "true"
    failureLimit: 1
    provider:
      job:
        spec:
          template:
            spec:
              containers:
              - name: fitness-test
                image: curlimages/curl
                command: ["/bin/sh", "-c"]
                args:
                - |
                  FITNESS_RESULT="false"
                  CANARY_SERVICE_URL="http://vote-preview"

                  # Perform the fitness test
                  RESPONSE=$(curl -s $CANARY_SERVICE_URL)

                  # Check if the response contains the expected string
                  if [[ "$RESPONSE" == *"Processed by container ID"* ]]; then
                    FITNESS_RESULT="true"
                  fi

                  # Return the fitness test result
                  echo $FITNESS_RESULT
              restartPolicy: Never
          backoffLimit: 1
Update Kustomization for Prod
File : prod/kustomization.yaml
apiVersion: kustomize.config.k8s.io/v1beta1
kind: Kustomization
resources:
- ../base
- ingress.yaml
- fitness-analysistemplate.yaml
- latency-analysistemplate.yaml
- loadtest-analysistemplate.yaml
apply
kustomize build prod
kubectl apply -k prod
watch the rollout using
kubectl argo rollouts get rollout vote